📌 Vehicle Info
NCM Model: 2020 / 118,030 km
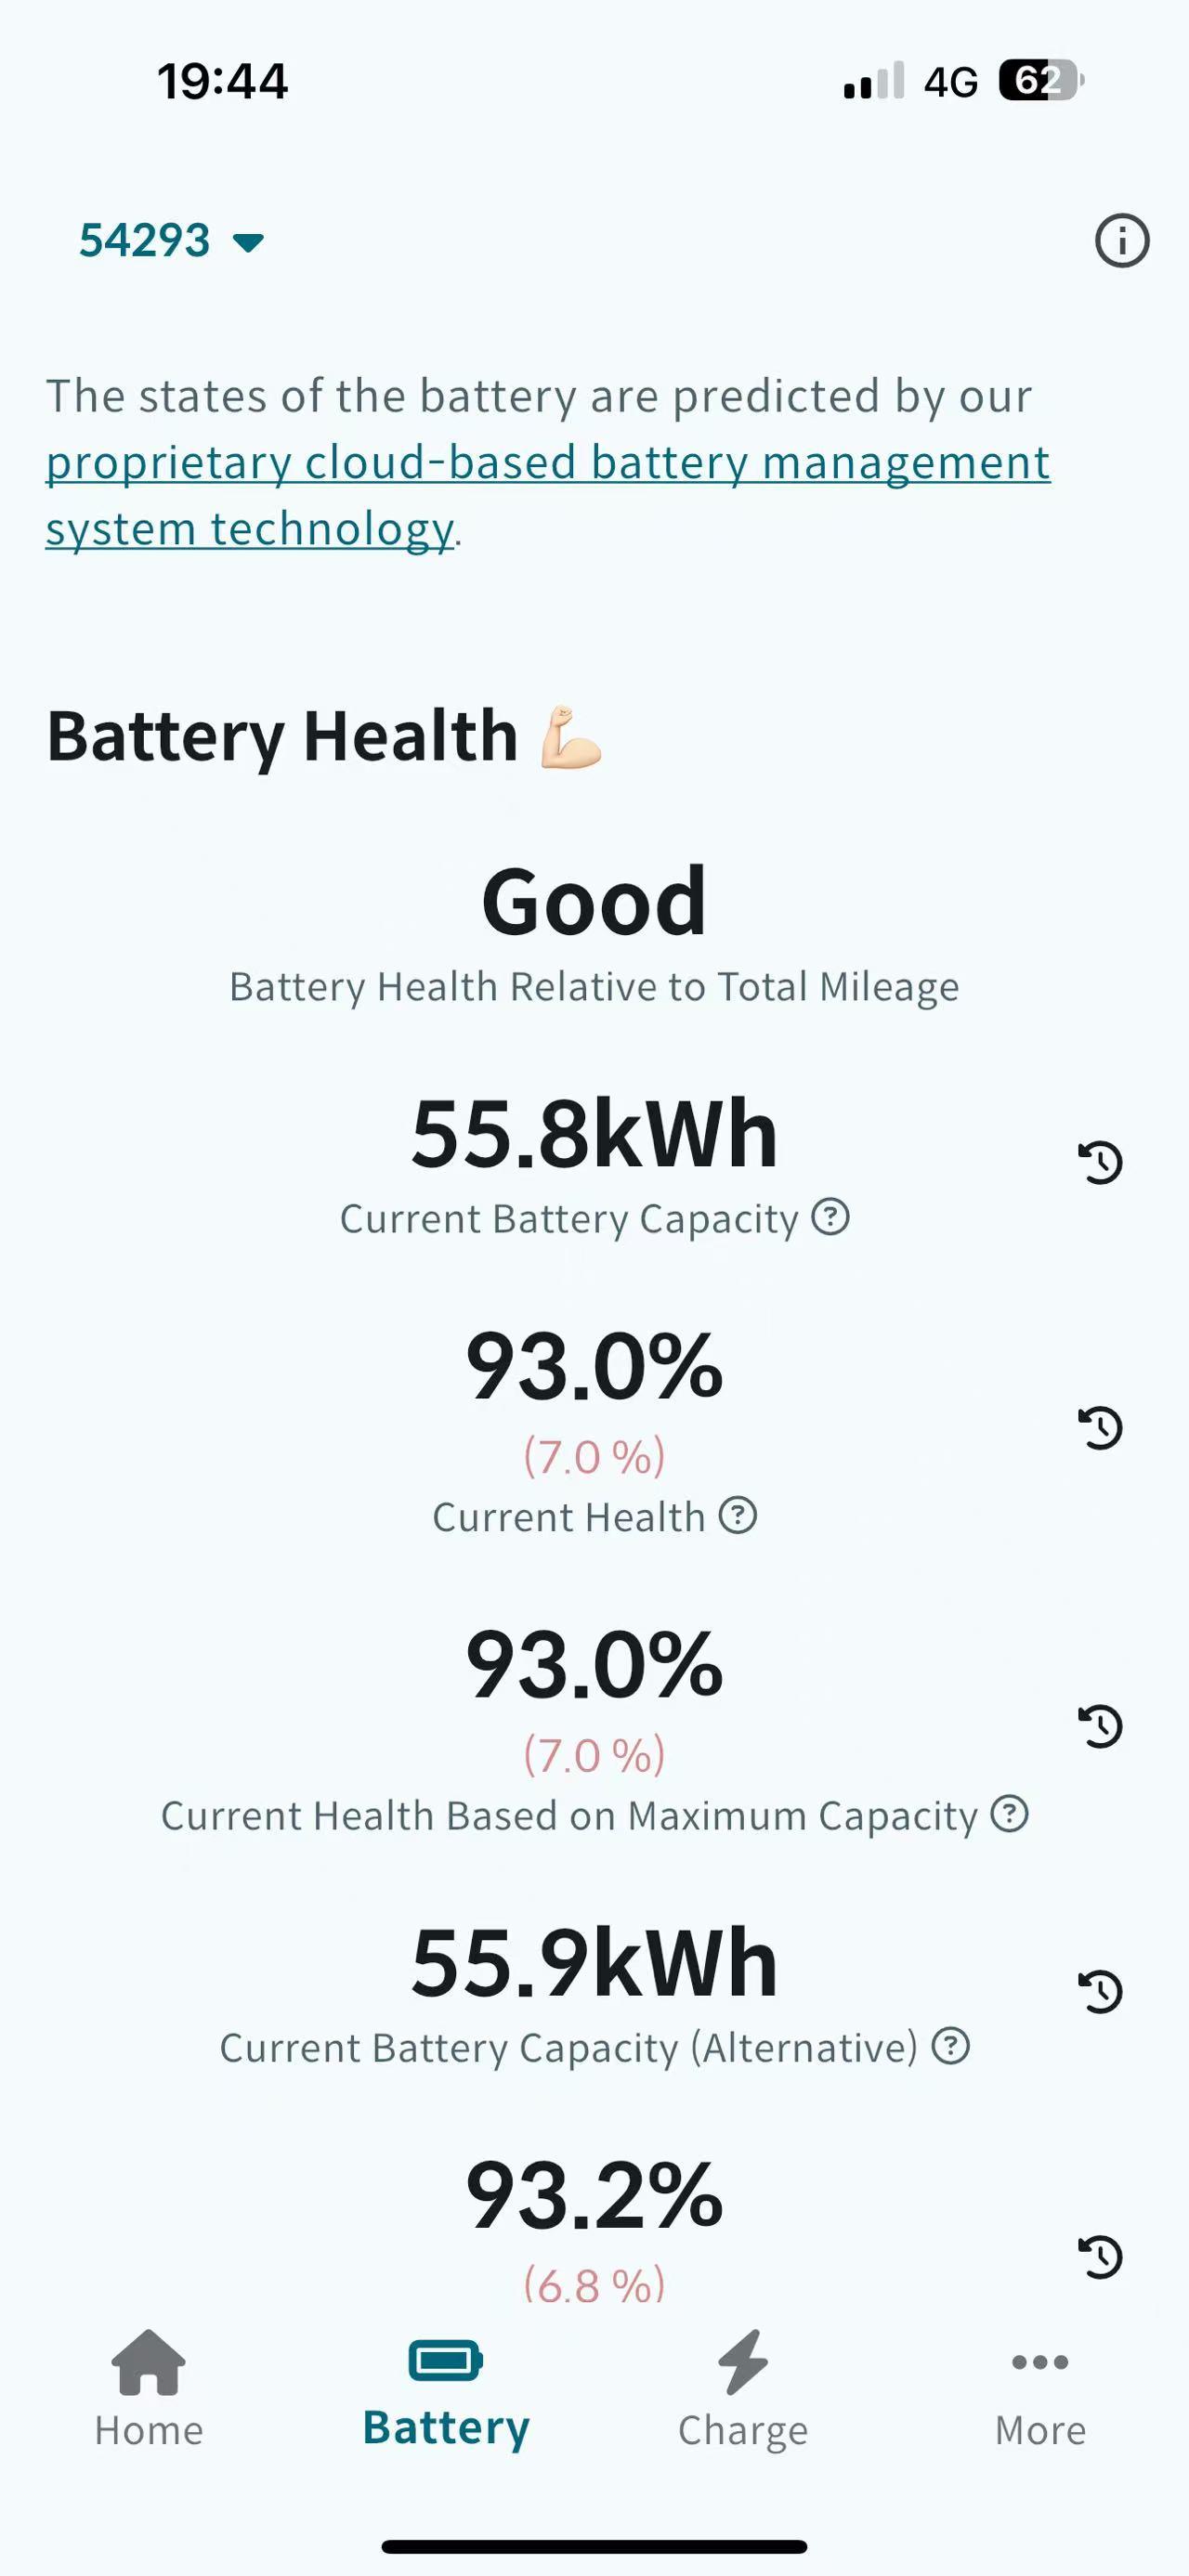
LFP Model: 2022 / 121,104 km


⚡ SOH (State of Health)
NCM: 82.7%
LFP: 93.0%


🔍 Key Observations
LFP shows higher SOH despite similar or even longer mileage
The SOH gap (~10%) suggests possible differences in degradation behavior depending on battery chemistry
🧪 Note
This is a single case, not statistically generalizable
LFP and NCM may have different degradation curves; both could reach SOH 70% at a similar point eventually
📊 Conclusion
LFP may maintain better health in early life
More data is needed for broader insights